Social Media, Chatbots, Messenger Marketing: stats you should know in 2020
Do you often look for up-to-date statistics on web users, social media, communication automation, instant messaging, chatbots or voicebots? At KODA Bots, we rely on third-party meaningful sources to support our own business data that we share once a month. So if you share the same mindset, you’ve come to the right place. We have compiled up-to-date statistics that we regularly update. You no longer have to search for the data you need, because you have it at hand, gathered in one place, ready to use in 2020 in your presentations, articles or conversations with clients.
1. The Internet
Worldwide, there are:
- 4.54 billion Internet users, which already makes up 59 percent of the world population (about 150 million more than last year);
- in Poland, 80.3 percent of residents use the Internet (2.3 percent more than last year);
- 5.19 billion unique users of mobile devices, i.e. 2/3 of the world’ population;
- as much as 3.80 billion social media users (more than 300 million new users in the last 12 months).
(Source: Digital in 2020 Global Overview, We Are Social, Hootsuite)
In comparison, last year there were:
- 4.388 billion Internet users, which made up 57 percent of the world population;
- in Poland, 78 percent of residents used the Internet;
- 5.11 billion unique users of mobile devices,
- 3.484 billion social media users.
(Source: Digital in 2019 Global Overview, We Are Social, Hootsuite)
- On average, Internet users spend 6 hours and 43 minutes online. This totals over 100 days per user and 40 percent of their time during the day when they are plugged in.
- Polish users spend 6 hours and 26 minutes online each day, with 2 hours actively using social media (last year they didn’t leave the Internet for 6 hours and 2 minutes each day.)
(Source: Digital in 2020 Global Overview, We Are Social, Hootsuite, 2020)
- The number of Internet users in Poland amounts to 30.63 million out of almost 38-million population. This is as much as 81 percent of the country’s population.
- A total of 56.5 percent users connect to the Internet via smartphone, and 42.4 percent use laptops and desktops. Tablets and other devices represent respectively: 1.1 percent and 0.004 percent.
(Source: Digital in 2020 Global Overview, We Are Social, Hootsuite, 2020)
- The number of Internet users totaled 28.2 million (as of April 2019.)
- In Poland, the number of users accessing the Web via PCs and laptops amounted to 22.6 million (a year-on-year decrease.)
- There were 24.4 million users accessing the Internet via smartphones.
(Source: Gemius/PBI, 2019)
- In comparison, the total number of Internet users in July 2018 stood at 26.9 million.
- Using PCs and laptops, 22.6 million users accessed the Web, while 22.1 million used also mobile devices to do so (out of which 21.7 million used smartphones.)
(Source: Gemius/PBI, 2018)
2. Social media
- Among Polish people, 19 million actively use social media. This amounts to 50 percent of the country’s total population.
- Among them, 97 percent access social media using a smartphone.
- And 99 percent use them regularly.
(Source: Digital in 2020 Global Overview, We Are Social, Hootsuite, 2020)
- In 2019, 18 million active users used social media (47 percent of the total population.)
- The average time spent on social media in Poland was 1 hour 45 minutes per day.
(Source: Digital in 2019 Global Overview, We Are Social, Hootsuite, 2019)
- Facebook remains the most popular social network in Poland. It has over 16 million users (2 million less than last year.)
- Among Polish users, 96 percent access Facebook via smartphone.
(Source: Digital in 2020 Global Overview, We Are Social, Hootsuite, 2020)
- There are 2.7 billion users using Facebook, WhatsApp, Instagram and Messenger each month.
(Source: Facebook, 2019)
- Facebook continues to be the most popular of the social media with over 2.449 billion unique users.
(Source: Digital in 2020 Global Overview, We Are Social, Hootsuite, 2020)
- A whopping 90.4 percent of Millennials, 77.5 percent of Generation X and 48.2 percent of baby boomers are active social media users.
(Source: eMarketer, 2019)
- Facebook is also the second most popular website in Poland. In only preceded by Google.
(Source: Statista, 2019)
- As many as 70 million businesses host a company page on Facebook.
(Source: Social Media Today, 2019)
- Twitter is used by 326 million active users each month.
- There are 500 million tweets sent daily on Twitter.
(Source: Omnicore, 2019)
- There are 590 million users of LinkedIn in over 200 countries.
(Source: Hootsuite, 2019)
- There are over 3.7 million registered users on LinkedIn in Poland.
(Source: Digital in 2020 Global Overview, We Are Social, Hootsuite, 2020)
- There were 3.5 million users of LinkedIn in Poland in 2019.
(Source: NapoleonCat, 2019)
- Of the traffic on LinkedIn, 57 percent is through mobile.
- A total of 30 million businesses have a LinkedIn profile.
(Source: Hootsuite, 2019)
- One billion people use Instagram every month, and as many as 500 million use it daily.
- There are 25 million business profiles on Instagram. Over 200 million users visit at least one business profile every day.
- And more than 60 percent (over 600 million) users search and discover new products on Instagram.
- Eighty percent of users follow at least one business on Instagram.
(Source: Hootsuite, 2019)
- Instagram in Poland has 7.30 million users.
(Source: Digital in 2020 Global Overview, We Are Social, Hootsuite, 2020)
- In 2019, Instagram had over 7.1 million active users in Poland.
(Source: NapoleonCat, 2019)
- Almost 3.2 billion people worldwide used Facebook, YouTube, WhatsApp, Instagram or Twitter, with nearly 3 billion of them on mobile devices.
- Only in 25 countries did Facebook not rank among the most popular social media platforms.
(Source: Digital in 2018 Global Overview, We Are Social, Hootsuite, 2018)
- Facebook is used by 98 percent of B2C businesses surveyed and 89 percent of B2C businesses.
- For 54 percent of B2B marketers, Facebook is their number one marketing platform.
(Source: Hootsuite, 2018)
- Among users, 96 percent voice their opinion about brands on social media and follow them there.
(Source: Lyfe Marketing, 2018)
- Two million businesses claim to use Facebook to advertise their products and services
(Source: Hootsuite, 2018)
- Users spend 75 percent of their time on just a few apps, mostly in the IM and social media categories.
(Source: Statista, 2018)
- In Q1 2018, Facebook had 2.2 billion monthly and 1.45 billion daily active users.
(Source: Facebook, 2018)
- While Facebook stands as the most popular social media service in Poland, it comes second only to Messenger among apps.
(Source: WirtualneMedia, 2018)
3. Instant messaging apps
- The number of WhatsApp users in the world totals 2 billion. That’s 400 million more than last year.
(Source: WhatsApp, 2020)
Among five most popular social media platforms, there are three instant messengers:
- WhatsApp with 1.6 billion* users,
- Messenger with 1.3 billion users,
- WeChat with 1.151 billion users.
*WhatsApp has released its own data on the number of users.
And the remaining big-name messaging apps have respectively:
- QQ Mobile – 731 million users,
- Skype – 300 million users,
- Viber – 260 million users,
- Telegram – 200 million users.
(Source: Digital in 2020 Global Overview, We Are Social, Hootsuite, 2020)

- Messenger ranks highest as the most popular instant messaging communicator in Poland. It has over 13.8 million users (as of November 2019.)
(NapoleonCat, 2019)
- By 2021, 2.48 billion people are expected to use messaging apps.
(Source: Statista, 2019)
- WhatsApp comes second among the most popular IM apps in Poland. It is used by 9 million people.
(Source: WirtualneMedia, 2019)
- A total of 80 percent of adult IM users write messages every day.
(Source: Facebook, 2018)
- WhatsApp and Facebook Messenger both have grown twice as fast as Facebook. The number of these apps users has increased by 30 percent.
- WhatsApp is the most popular app in 128 countries around the world.
(Source: Statista, 2018)
- WhatsApp recorded growth: in December 2018, as many as 7.7 million users were registered in Poland, which is twice as many as in the previous year.
(Source: Gemius, 2018)
- Besides Facebook, the most popular apps in Poland included Messenger (10.42 million users in May 2018) and WhatsApp (4.49 million users in May 2018.)
(Source: Wirtualne Media)
Is the article of value to you?
4. Messenger marketing
- The world’s average Internet user spends 3 hours and 40 minutes in smartphone apps. They spend 50 percent of that time sending messages.
(Source: Digital in 2020 Global Overview, We Are Social, Hootsuite, 2020)
- Every month, people and businesses exchange 20 billion messages in the Messenger app.
(Source: Facebook, 2019)
- A total of 24 percent of marketers have planned to include messaging apps into their content strategy in the next year.
(Source: HubSpot, 2018)
- By the end of 2018, 78 percent of smartphone users globally will be messaging on a monthly basis.
(Source: eMarketer, 2017)
- Every month, people and businesses have exchanged 8 billion messages in the Messenger app.
(Source: Facebook, 2018)

Facebook research shows that:
- 58 percent of users feel more confident messaging a business than contacting them by phone;
- 58 percent prefer messaging a business than filling out a form on a website;
- 53 percent of users prefer to do their shopping with businesses, to whom they can write directly,
- 55 percent prefer to communicate with a business through messages rather than email.
(Source: Facebook, 2018)
5. Chatbots
- 57 percent of businesses claim that a chatbot provides a great ROI with minimal investment.
- 47 percent of consumers declared their interest in buying a product through a chatbot.
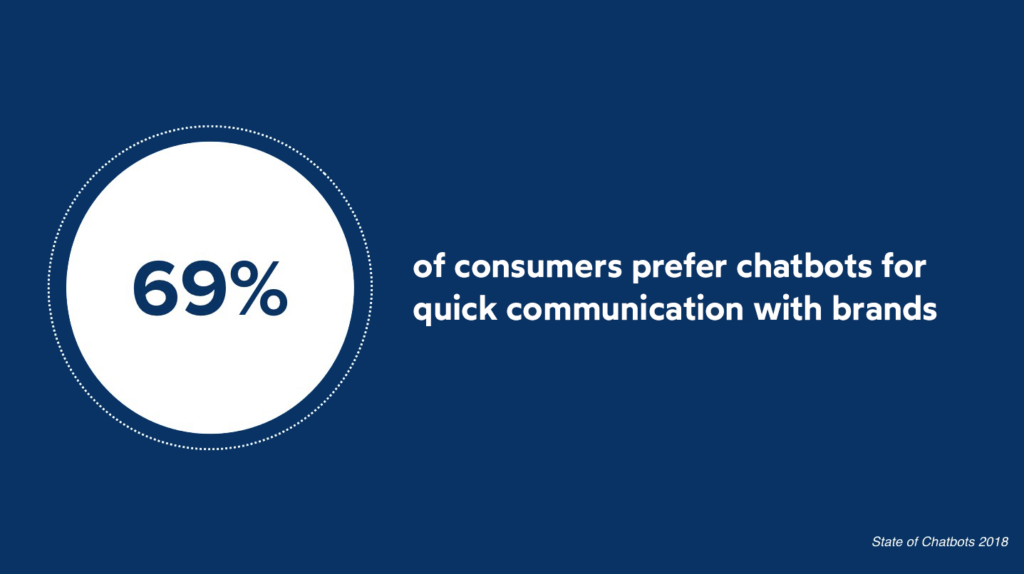
- 69 percent of consumers prefer to use chatbots for the speed at which they can communicate with a brand.
- 90 percent of businesses reported resolving customer issues faster using bots.
- In 2018, the global chatbot market was worth USD 1.274 billion and forecast to grow at a CAGR of 34.75 percent, reaching USD 7.591 billion by 2024.
(Source: Chatbot Market – Growth, Trends, and Forecast (2020 – 2025))
- There are over 300,000 chatbots used in Messenger (Facebook reported the same number the previous year.)
- By 2025, the chatbot market is expected to reach over USD 1.25 billion.
(Source: Statista, 2018)
- The speed of receiving a reply lies among the most important reasons for using chatbots: only 11 percent of respondents expect an immediate response after filling out a form as compared to 39 percent who expect it from a 1-on-1 video call and 42 percent – from chatbots.
- Thus, only 14 percent of people would rather fill out a form on a website than use a chatbot to contact a business.
- The expectation of customers in terms of response time from chatbots is almost identical to that of a face-to-face conversation.
(Source: State of Conversational Marketing, Drift, 2019)
People become more and more impatient about not being able to get answers to simple questions and 24/7 service.
Comparison of consumer frustrations in 2018 and 2019:
a) Not being able to get answers to simple questions:
- indicated by 31 percent of respondents in 2018
- increased to 34 percent in 2019
b) no service out of normal business hours:
- indicated by 16 percent of respondents in 2018
- increased to 18 percent in 2019
(Source: State of Conversational Marketing, Drift, 2019)
A growing number of younger people use chatbots as compared to the previous year. Among the respondents aged 18-24, 35 percent used chatbots in 2019 more compared to the previous year, in the age group 25-34 it was 27 percent, and 25-44 it totaled to 29 percent.
Advantages of using chatbots as indicated in survey:
- 42 percent of respondents pointed to ease of use as an advantage of chatbots;
- 40 percent of respondents indicated the 24/7 support availability (ranking highest of all other surveyed channels such as email, phone, video call);
- 30% pointed to the quick reply to simple questions.
(Source: State of Conversational Marketing, Drift, 2019)
Users want to use chatbots to:
- get their questions answered – 32 percent
- receive detailed answers or full explanations to their queries – 29 percent
- solve a problem or make a complaint – 27 percent
- access customer service – 27 percent
- pay bills – 23 percent
- book service (e.g. at a restaurant or hotel) – 22 percent
- make an appointment – 19 percent
- communicate with brands – 19 percent
- join a mailing list or news service – 18 percent
- make a purchase – 17 purchase
- find inspiration, ideas – 10 percent
(Source: State of Conversational Marketing, Drift, 2019)
People grow more comfortable when interacting with chatbots and have more confidence in their abilities. When asked “What would stop you from using a chatbot?” respondents answered:
- I prefer to talk to a human: 43 percent in 2018, and only 38 percent in 2019;
- I’m afraid of them making a mistake: 30 percent in 2018, down to 24 percent in 2019;
- I prefer to fill in online forms: 26 percent in 2018, and only 14 percent in 2019;
(Source: State of Conversational Marketing, Drift, 2019)
Sales companies indicated by 40 percent of respondents took the lead in engaging users via chatbot in the last year.
(Source: State of Conversational Marketing, Drift, 2019)
- A total of 53 percent of service businesses expect to use chatbots within the next 18 months, which is a 136-percent increase, promising a major impact of this solution in the near future.
- Of the consultants with chatbots, 64 percent are able to spend most of their time solving complex problems, as compared to 50 percent of consultants without chatbots.
(Source: State of service, SalesForce 2019)
- Among customers, 58 percent say that new technologies like chatbots and voice search have changed their expectations of businesses.
- 54 percent of customers claim businesses need to change the way they engage them.
- 77 percent say that chatbots will change their expectations of businesses within the next five years.
(Source: State of the Connected Customer, SalesForce 2019)
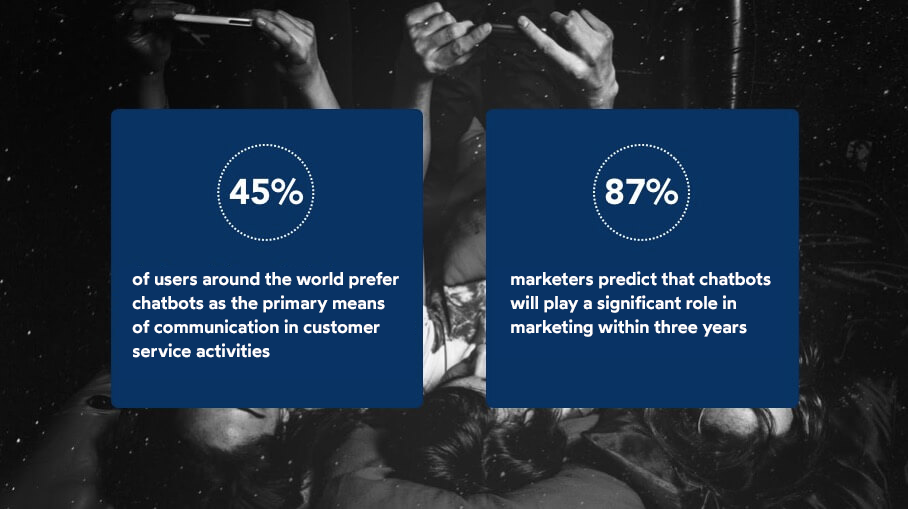
- Of global users, 45 percent prefer chatbots as the primary means of communication for customer service.
(Source: Statista, 2018)
- By 2020, 85 percent of all customer interactions will be handled by a virtual assistant.
(Source: IBM, 2018)
- 87 percent of marketers predict that chatbots will play a significant role in marketing within three years.
(Source: Google, 2018)
- A total of 66 percent of Polish respondents do not know what chatbots are.
(Source: Mobile Travel Report Polska, 2017)
- Young people aged between 18 and 24 years old are the most aware of the latest trends (55%), while older people over 65 are the least aware (21%).
(Source: Mobile Travel Report Polska, 2017)
The highest number of people use chatbots:
- when shopping online (50%);
- to contact customer service (43%);
- 28% of respondents have already used chatbots when planning vacation.
(Source: Mobile Travel Report Polska, 2017)
- 50% consider the greatest advantage of chatbots to be their availability 24 hours a day,
- 39% of Polish respondents agree that chatbots provide thorough answers to their questions.
(Source: Mobile Travel Report Polska, 2017)
- More than a quarter of US consumers use chatbots on a daily basis.
(Source: The Chatbot Consumer Report, 2017)
- Consumers value chatbots for their ease of use (24%) and speed of response (21%).
(Source: The Chatbot Consumer Report, 2017)
- US customers most often depend on chatbots for customer service (51%) and product research (48%).
(Source: The Chatbot Consumer Report, 2017)
- Concerns about data security are the biggest issue with chatbot communication, among 38 percent of respondents.
- The Polish respondents are concerned about not being understood (27%) and that their conversation will be manipulated in some way (22%).
(Source: Mobile Travel Report Polska, 2017)
- Only 5 percent of American consumers see no value in chatbots.
(Source: The Chatbot Consumer Report, 2017)
6. Voicebots
- Globally, the use of voice interfaces has increased by more than 9% over the past year.
- Each month, 43 percent of the world’s Internet users between 16 and 64 years old use voice search and voice commands on any device.
- If this figure applied to the entire global Internet user base, it would equal nearly 2 billion active users monthly.
- In Poland, 25 percent of Internet users use voice search every month. This is an increase by 7 percent as compared to last year.
(Source: Digital in 2020 Global Overview, We Are Social, Hootsuite, 2020)
- Out of businesses who have implemented a voice assistant, 71 percent say it improves the customer experience.
- Among users, 94 percent agree that voice search is easy to use.
- By the same token, 49 percent of users say that it is not intuitive to use voice search technology. The problem arises with starting commands (how to ask? – do you know it?).
- Most commonly, we use Voice Assistants to manage banking (61%) or travel planning (52%).
(Source: Adobe 2019)
- Smart assistants are on the rise in the US, with nearly 112 million users in 2019.
- Based on forecasts, their popularity will continue to grow to 122.7 million users in 2021. These assistants are used willingly by both smartphone owners and smart speaker users.
- At present, the American market is basically dominated by 3 platforms: Siri by Apple, Amazon Alexa and Google Assistant (the last one is available in Poland in a local language version.)
- By the end of 2019, 97.9 million users will use voice assistants with their smartphones. This figure is expected to jump to 107.9 million by 2021.
(Source: eMarketer, 2019)
- By 2023, the availability of digital assistants on smartphones is expected to increase to 90 percent.
(Source: Strategy Analytics, 2018)
- The number of voice assistants will triple by 2023. Assuming the outlook is correct, their number will reach 8 billion worldwide. This would result in a figure greater than the current population of Earth.
(Source: Juniper Research, 2018)
- Within three years, 40 percent of consumers will use a voice assistant instead of a mobile app or website.
(Source: Capgemini, Conversional Commerce Report Digital, 2018)
- The majority knows what voice assistants are. Only 10 percent of respondents state they have never heard of them.
(Source: PwC, 2018)
- Among the US respondents, 46 percent use voice assistants. In India and China, it’s as much as 55 percent.
(Source: Voicebots Ahead, 2018)
- A whopping 81 percent of voice assistant users use them via smartphones. 25% do so through smart-speaker devices (e.g. Amazon Echo / Google Home.)
(Source: Capgemini, Conversional Commerce Report Digital, 2018)
- Voice assistants are used at home on smart speakers for activities such as multitasking, cooking or watching TV.
(Source: PwC, 2018)
Among those using voice assistants:
- 82 percent use them to search for information: news, weather forecast, recipes, etc.;
- 67 percent use them to play music or stream movies;
- 36 percent have accessed customer service with them;
- 35 percent have purchased products such as groceries and clothing via voice assistants;
- 56 percent would be interested in making dining orders using voice assistants;
- 44 percent are interested in using voice assistants to perform banking transactions;
- Finally, four in five users say they are satisfied with their purchase using voice assistants.
(Source: Capgemini, Conversional Commerce Report Digital, 2018)
- By 2023, voice commerce sales will reach USD 80 billion annually.
(Source: Juniper Research, 2018)
Consumers accept listening to ads while using their voice assistant if:
- they have the option to skip the ad, if they don’t like it – 88%;
- they’re asked if they want to listen to the ad before it plays – 82%;
- ads don’t interfere with their previous activities (e.g. listening to music) – 81%;
- they can choose which ads they listen to – 80%;
- ads get personalized by comments/questions which users have previously asked voice assistants – 73%;
- ads refer to replies to inquiries (e.g., restaurant inquiry, paid advertiser reply) – 71%;
- they can communicate with an ad by talking to it – 70%;
- ads are linked to the liked brands on the user’s social media – 70%.
(Source: Consumer Intelligence Series: Prepare for the voice revolution, PwC, 2018)
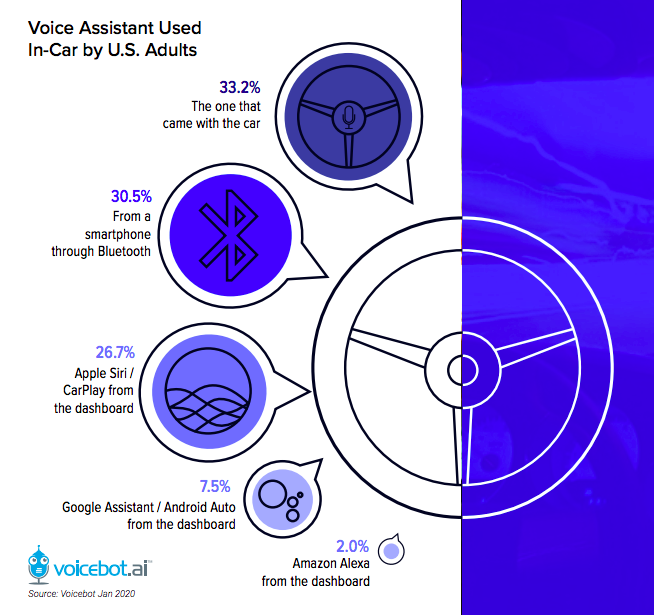
- In-car voice assistant users increased by 8.7% from 77.1 million to 83.8 million, while daily active users rose by 7.6% from 27.6 million to 29.7 million.
- 129.7 million users who have used voice assistants while driving since January 2020 represents a 13.7-percent increase as compared to September 2018.
(Source: In Car Voice Assistant Consumer Adaptation Report, 2020)
7. Mobile
- mong Polish users, 28.55 million access the Internet via mobile devices,
- which amounts to 93 percent of the total number of internet users;
- 92 percent access the Internet using a smartphone.
- 2 hours and 51 minutes represents the average time a user spends online on a mobile device.
(Source: Digital in 2020 Global Overview, We Are Social, Hootsuite, 2020)
- Digital devices assist consumers in 6 out of 10 shopping visits.
(Source: Deloitte, 2019)
- 48 percent of customers search for the product they intend to buy on mobile devices.
(Source: Google, 2018)
- 89 percent of smartphone users use apps, while only 11 percent use regular websites.
(Source: Disruptive Advertising, 2018)
- By 2021, the global base of mobile messaging users is expected to grow by another 23 percent.
(Source: eMarketer, 2018)
Contact with us
You are one step away from separating yourself from the communication community in your organization
You can contact us and we will prepare a dedicated offer for you.